SQL Server Performance Monitor and PAL
Sometimes we want to know the performance of the server that host SQL Server or even check the performance of SQL Server itself for a period of time. One way of doing it is by using the Performance Monitor tool which is available on the Windows Server and we can schedule this tool to capture the data (which is called performance counter) to later be analyzed using PAL tools.
For this part, you need to download PAL tool first and install it on your windows:
(you can download the PAL 2.8.2.1 installer from the github)
Here are the steps that can be followed to setup Performance Monitor and Use PAL Tool.
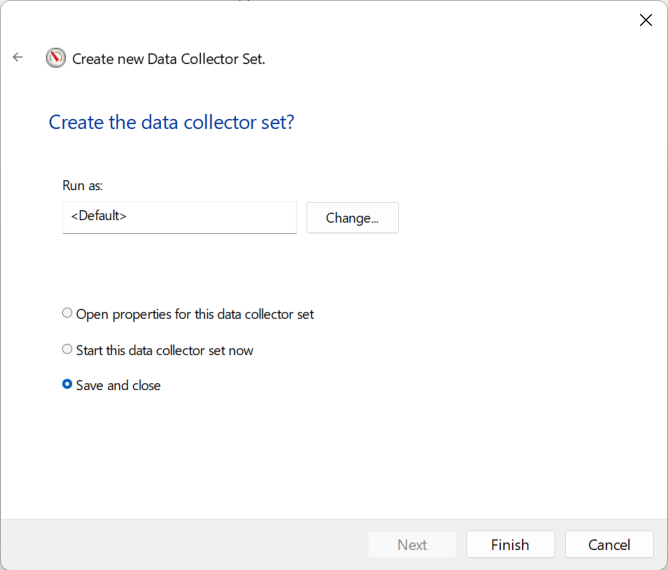
1. Setup a perfmon data collector

Define a perfmon data collector and then add counters to the perfmon, configure path file to save the output of the perfmon.


2. List of Counters to be added

Here are some counters that needs to be added to the perfmon counters:
Notes: remember to select all instance for each counter, symbol should be (*)
Notes2: for SQL Server instance, apply corresponding counters for either default instance or named instance accordingly
CacheLogical DiskMemoryMSRS Web ServiceNetwork InterfacePaging FilePhysical DiskProcessProcessorProcessor InformationReportServer:ServiceServerSQLAgent:JobsSQLAgent:JobStepsSystemTCPv4MSSQL$MSSQLSERVER16:Access MethodsMSSQL$MSSQLSERVER16:Availability ReplicaMSSQL$MSSQLSERVER16:Buffer ManagerMSSQL$MSSQLSERVER16:Cursor Manager by TypeMSSQL$MSSQLSERVER16:Database ReplicaMSSQL$MSSQLSERVER16:DatabasesMSSQL$MSSQLSERVER16:Deprecated FeaturesMSSQL$MSSQLSERVER16:General StatisticsMSSQL$MSSQLSERVER16:LatchesMSSQL$MSSQLSERVER16:LocksMSSQL$MSSQLSERVER16:Memory ManagerMSSQL$MSSQLSERVER16:Plan CacheMSSQL$MSSQLSERVER16:SQL ErrorsMSSQL$MSSQLSERVER16:SQL StatisticsMSSQL$MSSQLSERVER16:TransactionsMSSQL$MSSQLSERVER16:Workload Group Stats

3. Schedule and Set the Duration of the perfmon


4. Start the perfmon and let it finish


5. Open PAL Tools to analyze the data
Now open the PAL tools that you have downloaded before, and we will use this to analyse the captured perfmon data.

The tool will be looking like this and then we select the .blg data as source to be analyzed

6. Configure the PAL to analyze SQL Server and Server Resources
Next is to configure the PAL to analyze SQL Server which we will use the template that already exist in PAL. Here is the template that usually can be used to create a complete report on server resources and SQL server counters:

Use the SQL Server 2014 template, but add additional threshold files:
SystemOverview.xml, WindowsUpdate.xml, and SQLServer2012.xml
Also include recursively inherited:
QuickSystemOverview.xml and SQLServer2008R2.xml
Add this template from the default installation path of PAL which is in
C:\Program Files\PAL\PAL
7. Input the server total RAM and configure the output path for the PAL result

Next is you need to input the total RAM of the targeted server for analysis in PhysicalMemory question.

Don't forget to define the output file.
8. Start the PAL Analysis and wait until it finish
Start the PAL and then a new command prompt window will pop-up, let it process all the data and it might take some time if the data is big (so you can just leave it be) and then when PAL has finished, it will show you the report result and you can start to analyze the server's condition based on the collected perfmon data.

Result should be looking like this.
And that's all for this part, now you can analyze server's condition based on perfmon data.
Comments
Post a Comment